
Want to try it yourself?
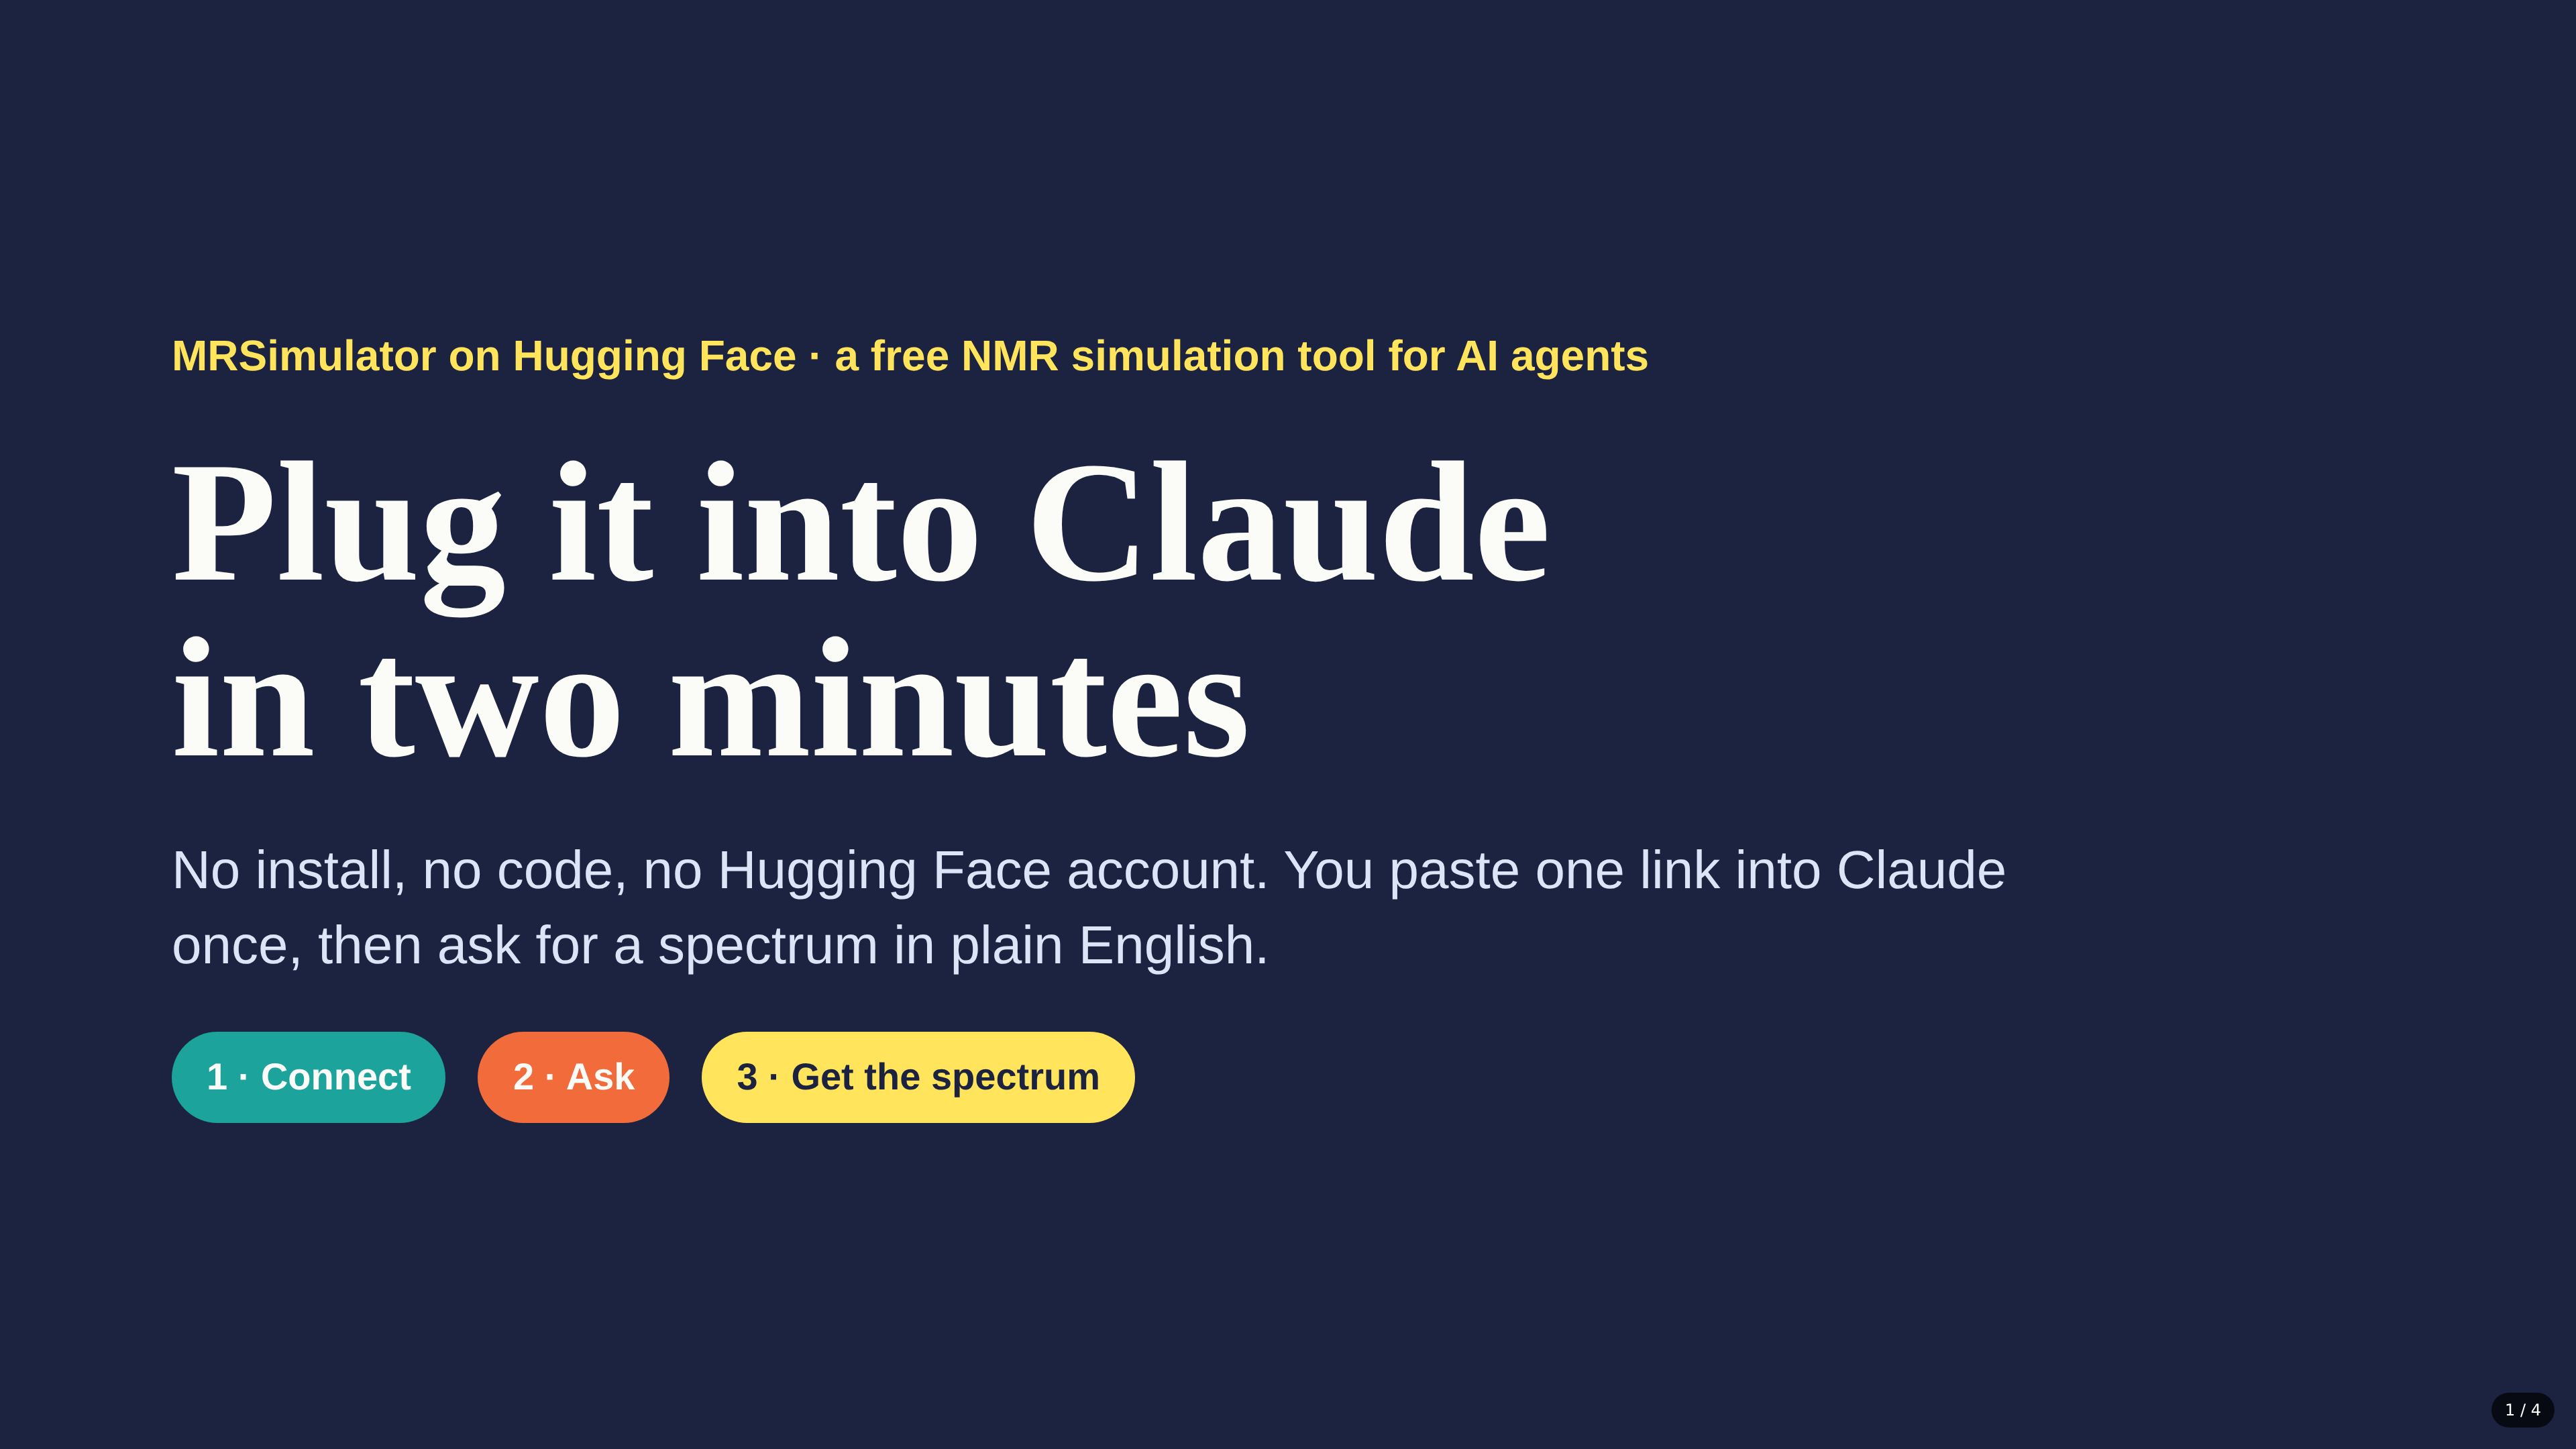
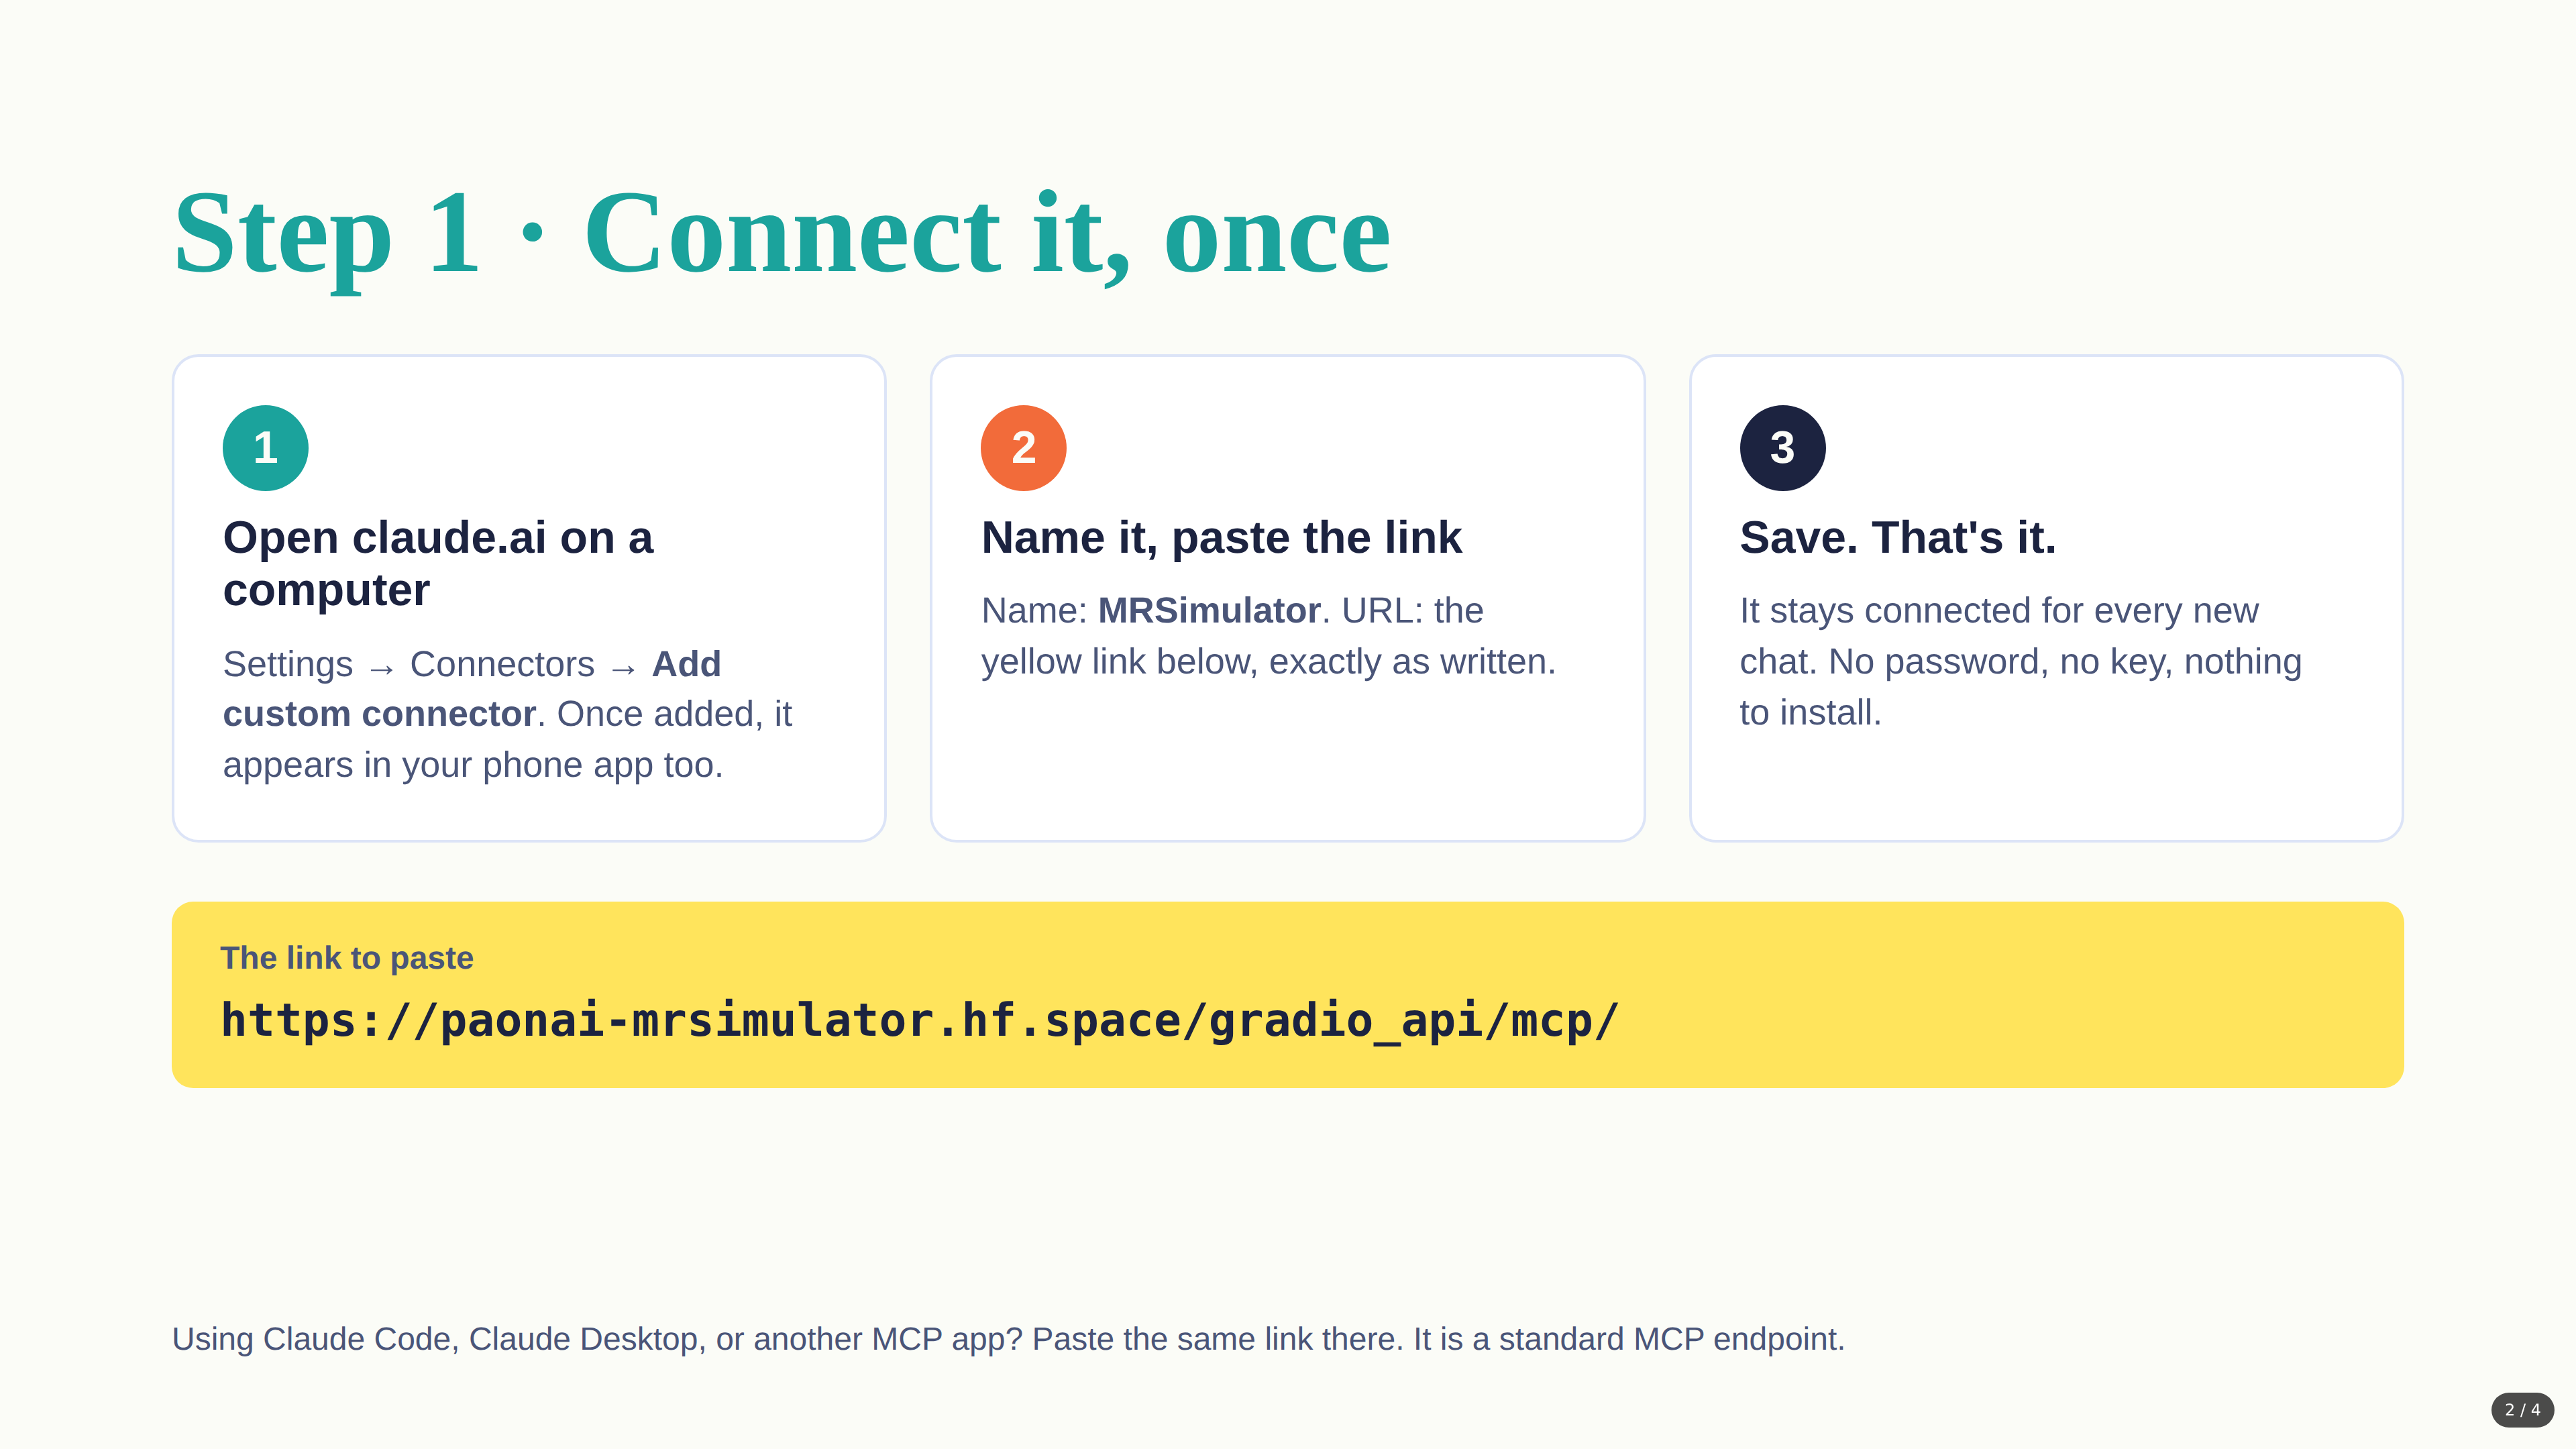
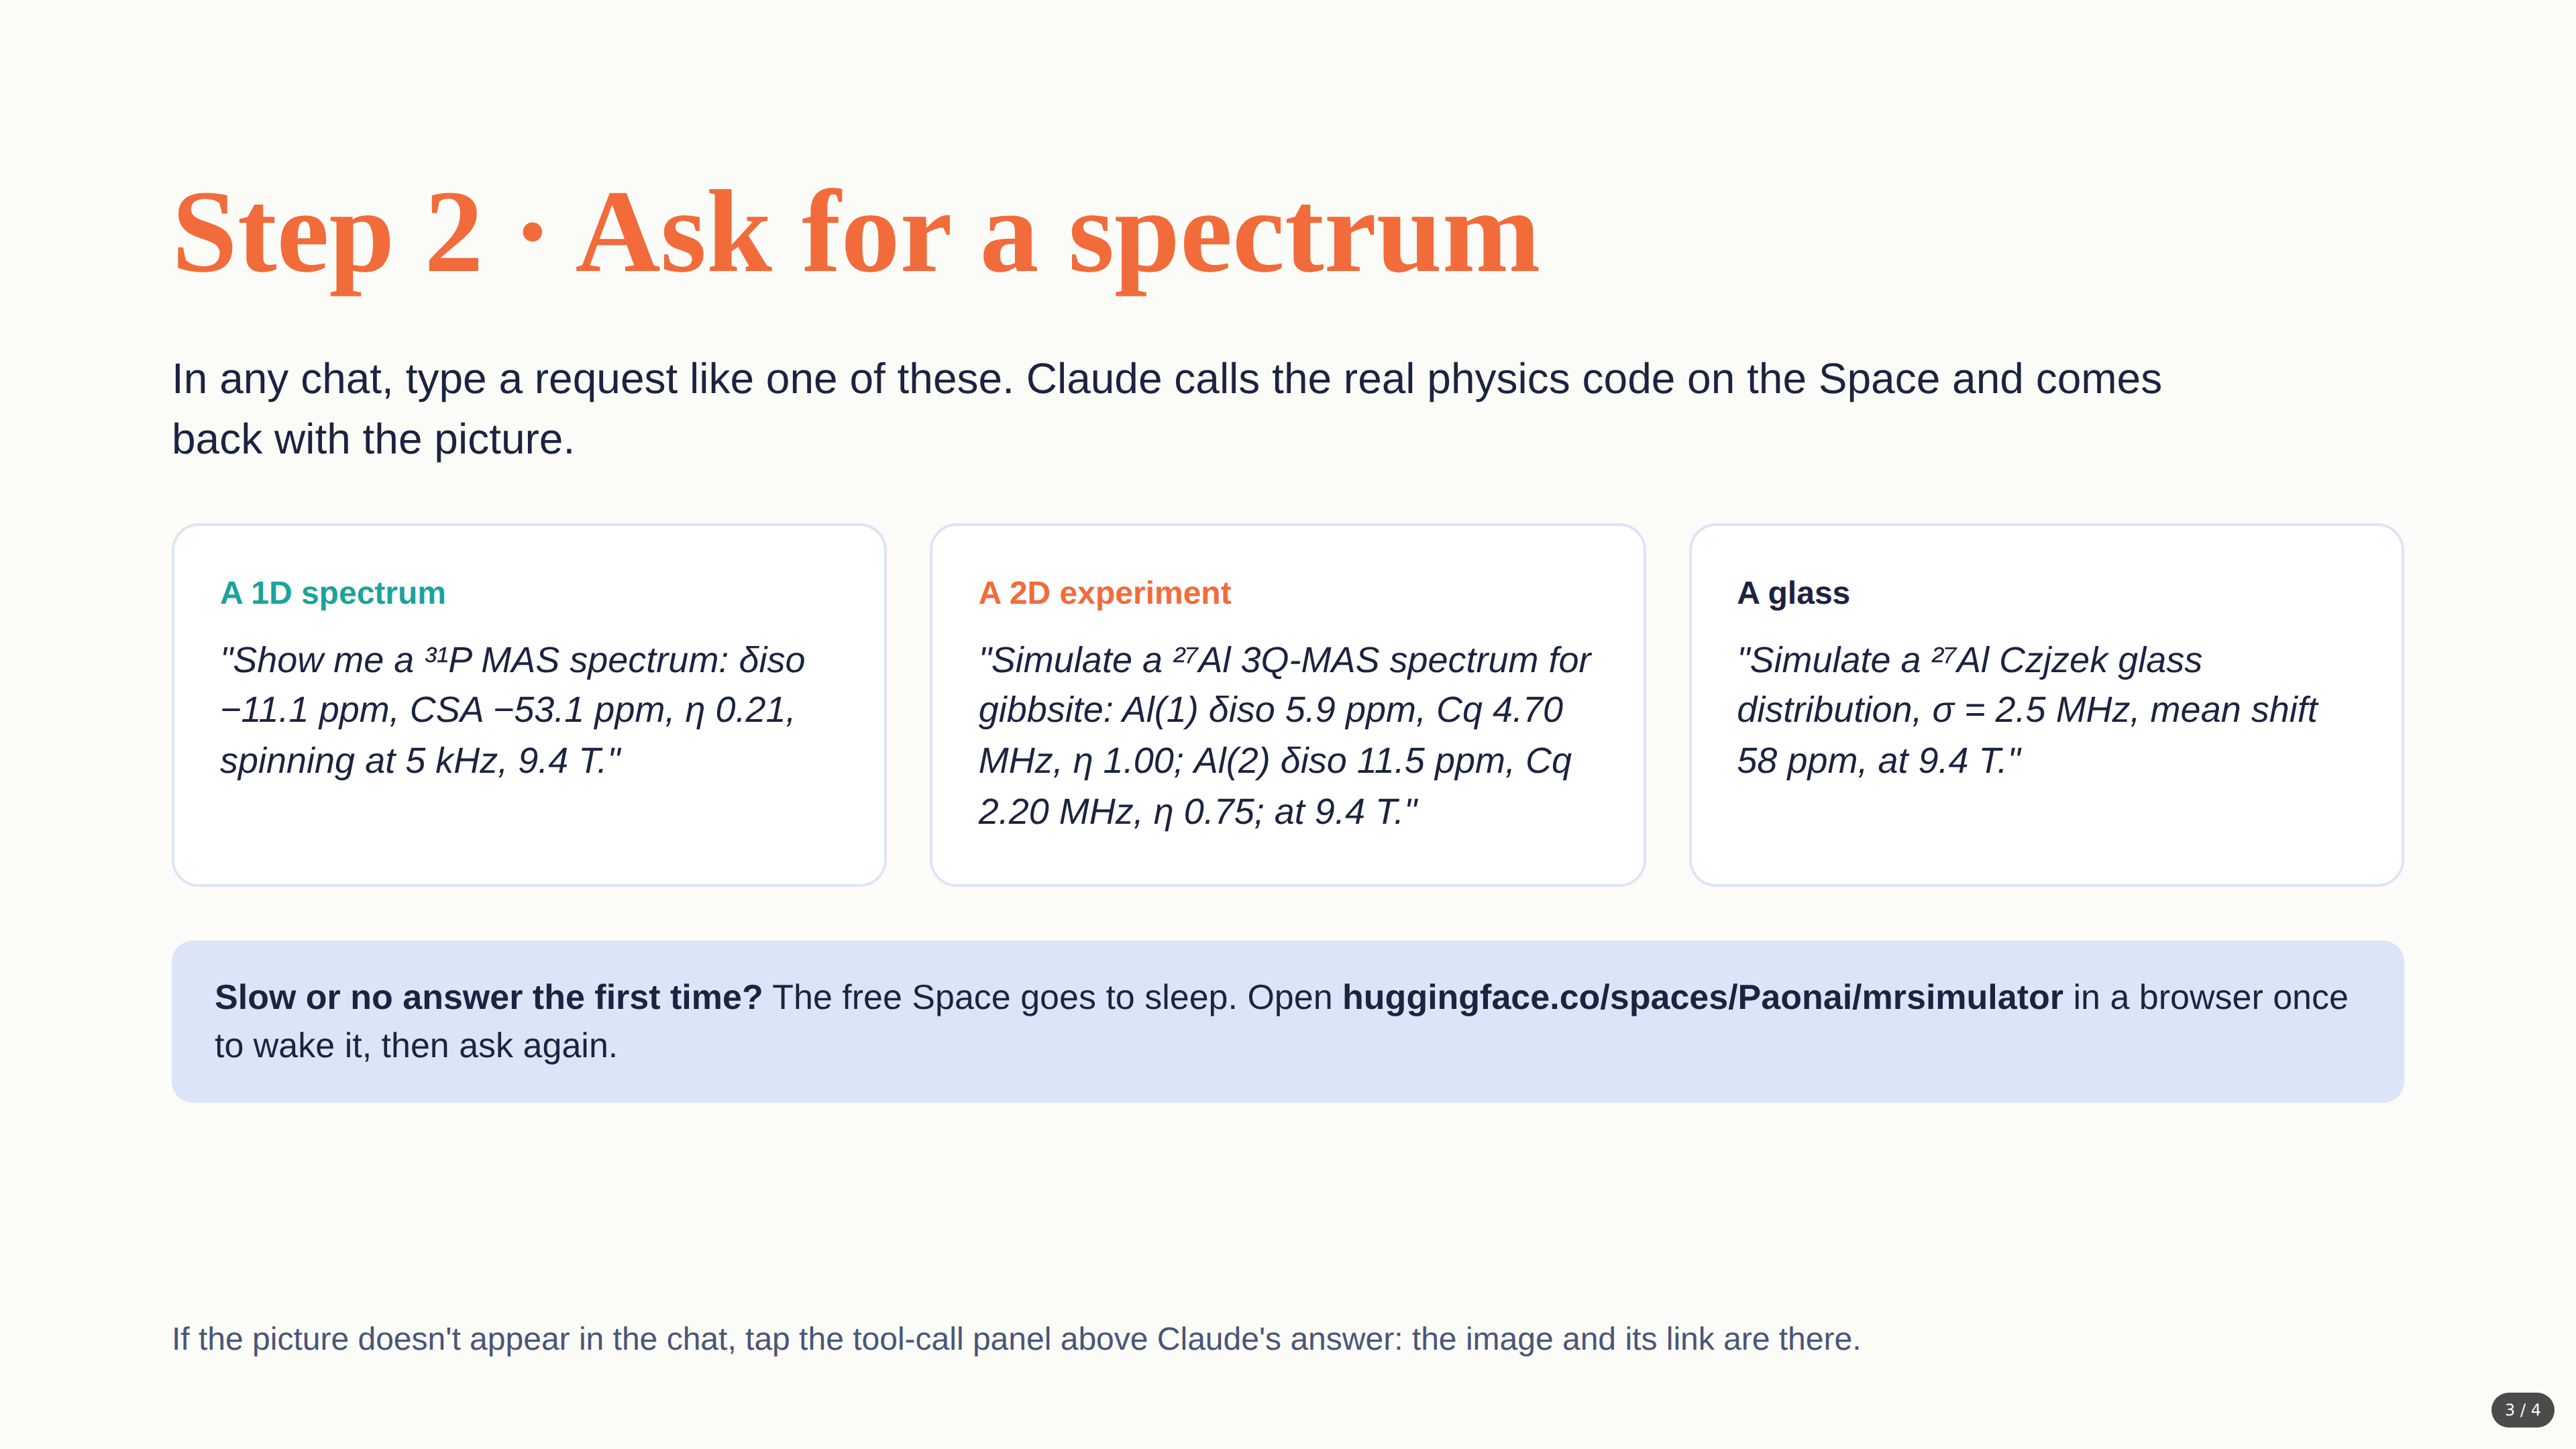
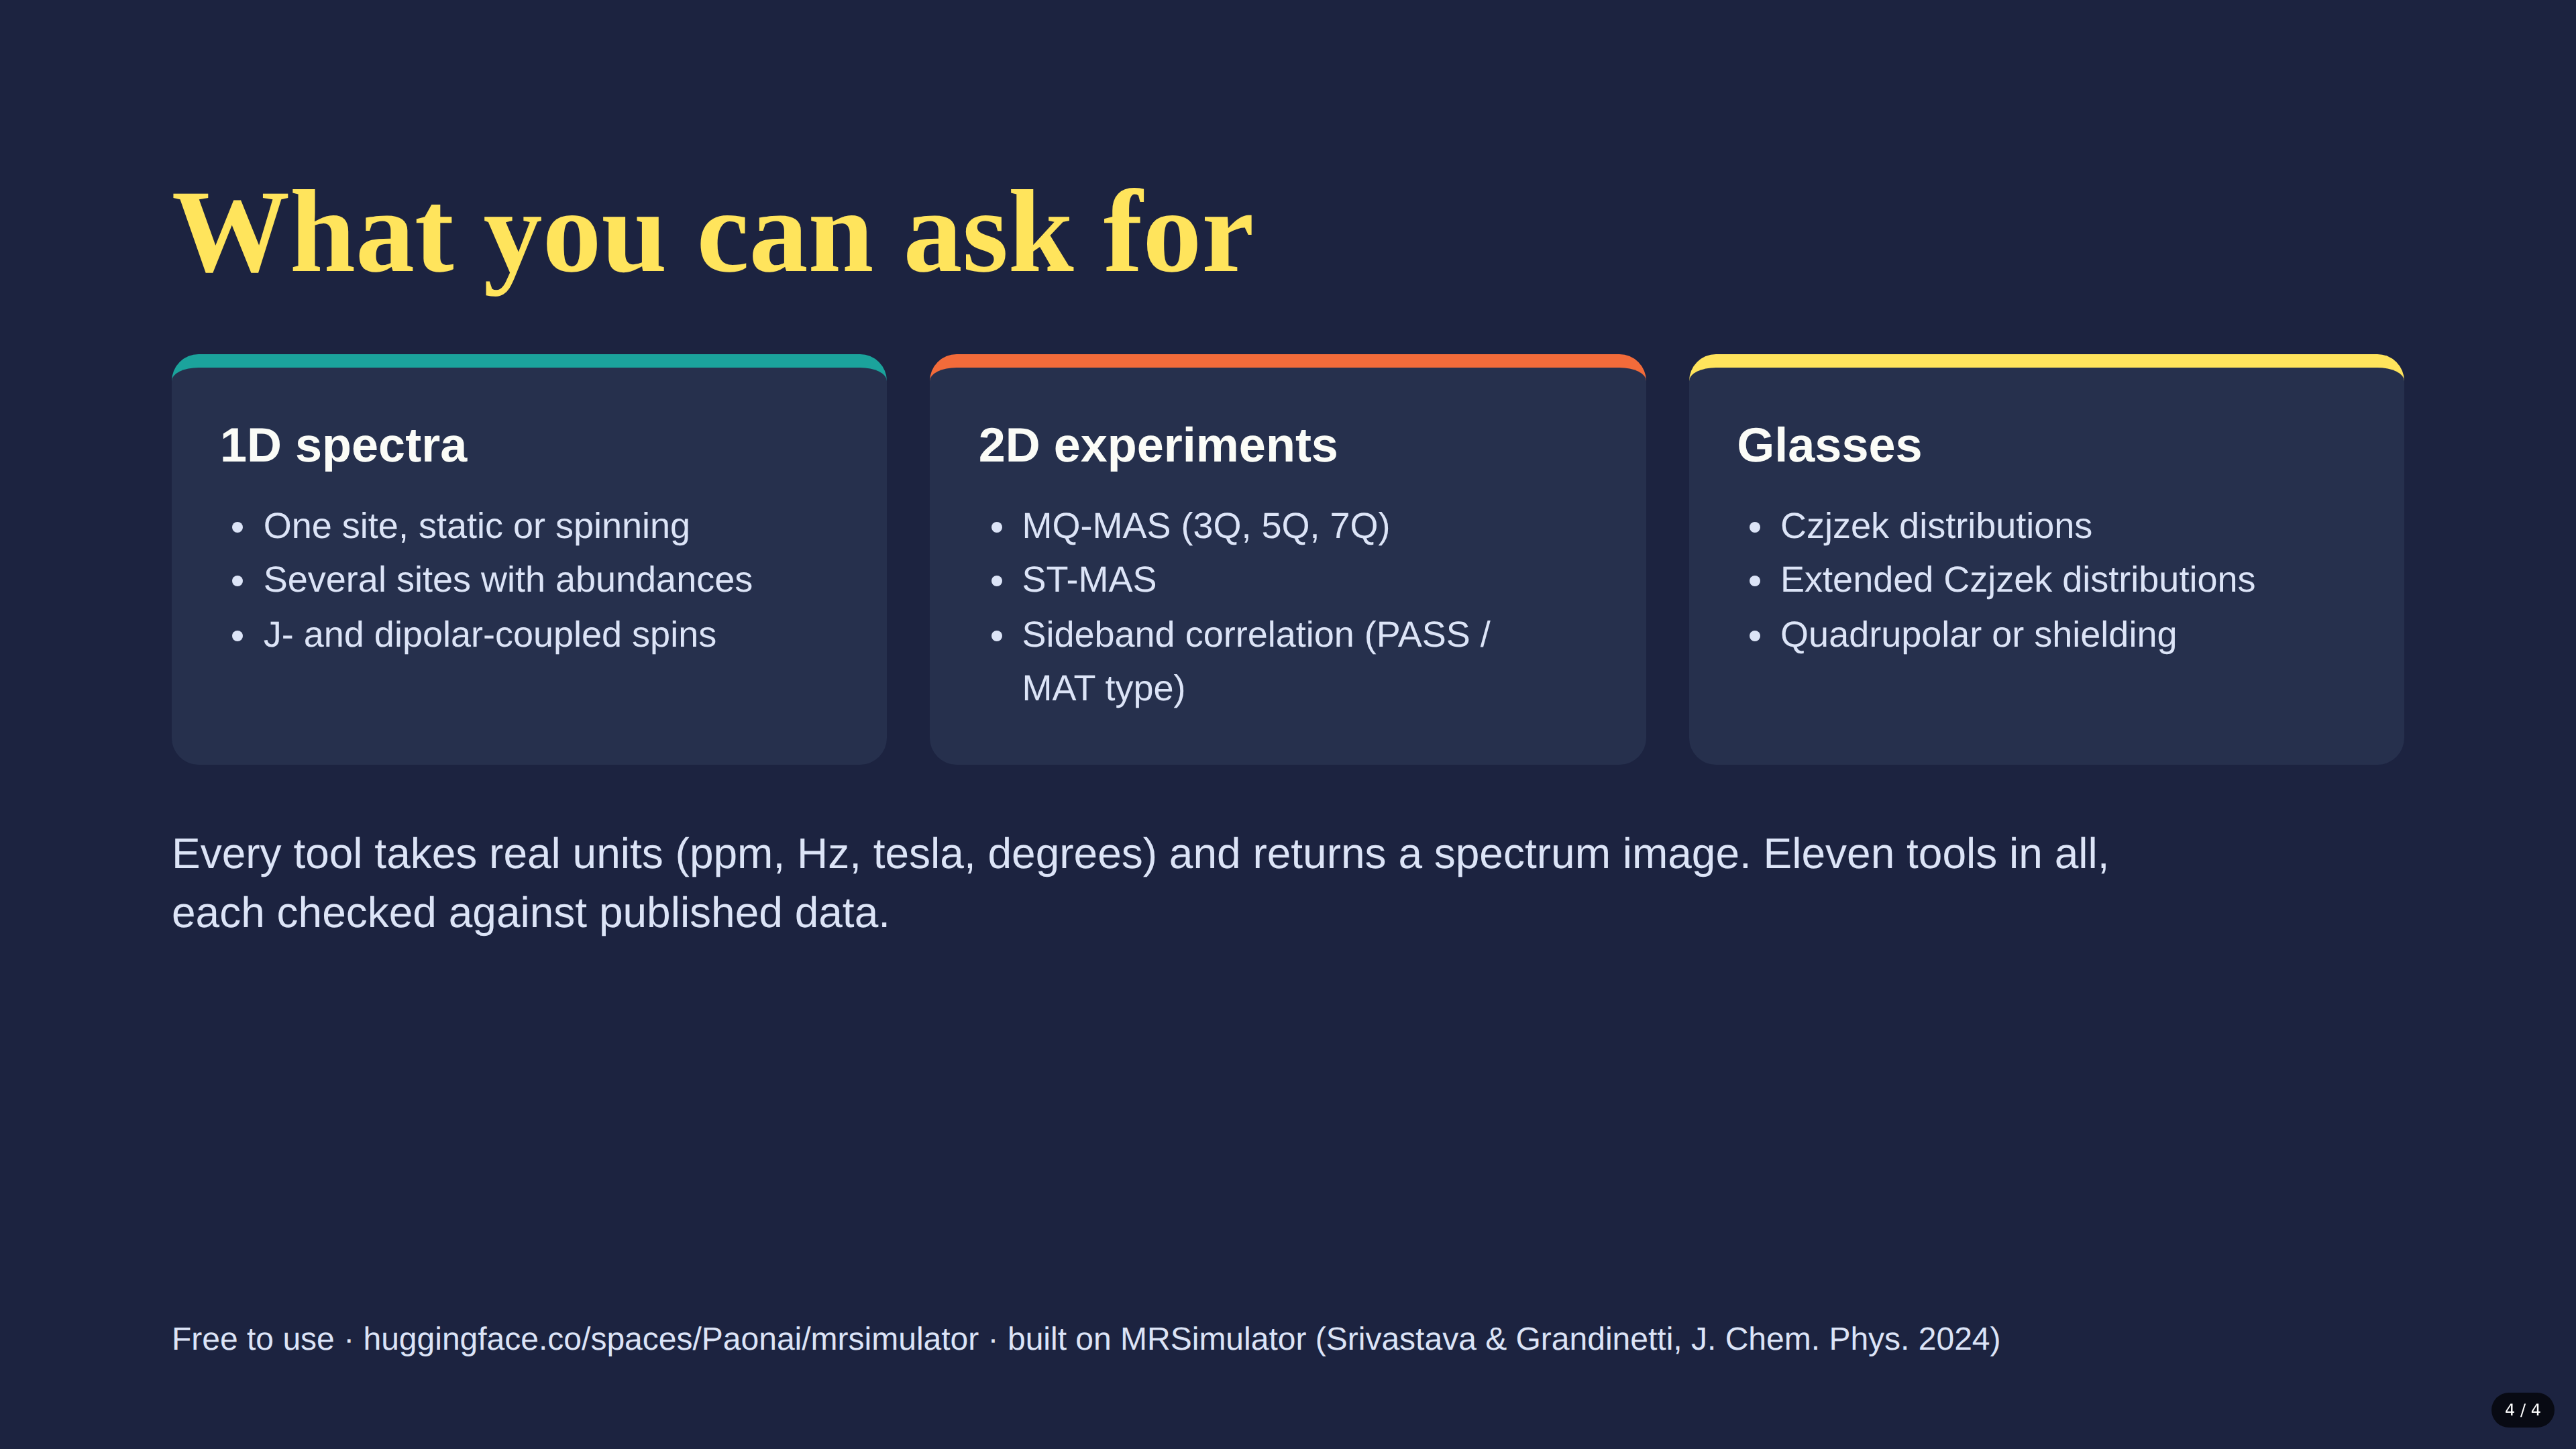
The MRSimulator Space is a real MCP connector — add it to Claude and you can ask it to simulate NMR spectra directly in your own conversations. Here's how to connect it, in four slides. Swipe left/right to move between them, and tap a slide to see it bigger:
Part 1 — What we did
The starting point
It began with the Paper2Agent paper (Miao et al., Nature, 2026): a framework that turns a research paper's codebase into an MCP server, so it becomes an interrogable "agent" instead of a static PDF. We discussed how the framework works, its cost (~$14 and 45 minutes per paper), and how it fits into Anthropic's product landscape.
Proving the concept by hand
Rather than just discussing it, we ran a scaled-down version of the same pipeline ourselves:
- Found a real solid-state NMR method paper with public code: MRSimulator (Srivastava & Grandinetti, J. Chem. Phys. 2024, GitHub). Installed it, ran its own tutorial, and confirmed it reproduced the expected physics (a chemical-shift-anisotropy powder pattern).
- Extracted a reusable Python tool from that tutorial — the same "tool extraction" step Paper2Agent automates.
- Applied that tool to two real data papers with no code of their own: ThF₄ ¹⁹F NMR (Martel et al., Inorg. Chem. 2018) and a phosphate series ³¹P NMR study (Martel et al., Solid State NMR 2020). We pulled their published tables (chemical shifts, anisotropy, DFT-calculated values) and reconstructed full simulated spectra from the raw numbers.
- Cross-checked our numbers against the papers' own reported statistics — our regression slope (−0.937) matched their stated −0.938, and our mean-absolute-errors (2.11 / 1.79 ppm) matched their reported 2.1 / 1.8 ppm almost exactly.
- Went further than a simple table lookup: simulated entire spectra from experimental parameters versus from DFT-calculated parameters and overlaid them — something neither original paper actually did.
- Caught and fixed a real bug along the way: the NMR chemical-shift axis needs to run high-to-low left-to-right by convention, and our early plots were inconsistent about it.
- When the actual phosphate paper PDF was uploaded, we extracted its real embedded figures directly (bypassing a robots.txt block that had stopped us from fetching them over the web) and confirmed our reconstructions matched the published figures almost exactly.
From script to real MCP server
- A first version using the official
mcpPython SDK — and in the process discovered its API had changed (FastMCPrenamed toMCPServerbetween SDK versions), which we verified by installing the package rather than assuming. - Tested it end-to-end with a real MCP protocol handshake (
initialize,tools/list) over both local (stdio) and remote (streamable-HTTP) transport. - Switched to a Gradio-based version once Docker hosting turned out to require a paid Hugging Face tier — Gradio has native MCP support (
launch(mcp_server=True)) that runs free.
Deploying and debugging for real
- Worked through picking the right Hugging Face Space SDK (Gradio, not Docker or Static), writing
requirements.txtand aREADME.mdwith the right YAML metadata. - Cleared up a misconception that GitHub was required — Hugging Face Spaces has its own in-browser file editor.
- Diagnosed and fixed a real deployment error (
No @spaces.GPU function detected) — added a harmless dummy GPU function to satisfy the platform's startup check. - Debugged a failed connector attempt (cold-start timing).
Closing the loop
Once the connector was live, the deployed Hugging Face Space was called directly, from a separate conversation, as a genuine MCP tool — reproducing the same ThF₄ spectrum built by hand many turns earlier, now served by its own infrastructure.
Expanding to the full method library
The server grew from 2 tools to 7:
| Tool | Physics |
|---|---|
| Single site | Chemical shift anisotropy and/or quadrupolar coupling |
| Multi-site | Same, for several sites with relative abundances |
| Coupled two-site | J-coupling and/or dipolar coupling |
| MQ-MAS (2D) | Multi-quantum MAS correlation (3Q/5Q/7Q) for quadrupolar nuclei |
| ST-MAS (2D) | Satellite-transition MAS correlation |
| Sideband correlation (2D) | PASS/MAT-type isotropic/anisotropic separation |
| Amorphous distribution | Czjzek / extended-Czjzek disorder models |
Testing caught a genuine bug — the named 2D methods (MQ-MAS, ST-MAS) assume idealized infinite-speed spinning internally and reject an explicit spinning-rate parameter. One real gap was documented rather than faked: dynamic-angle spinning (DAS) and magic-angle flipping (MAF) aren't implemented as ready classes in the installed library version.
How it relates to the original paper
The end state matches Paper2Agent's core definition — a method paper's codebase, wrapped as a remotely-hosted MCP server, connected to a chat agent. Where it differs: Paper2Agent's own pipeline is fully autonomous, finishing in ~45 minutes; this was hand-crafted and iterated on over many turns, missing the "resources" and "prompts" parts of the framework, but going broader in method coverage than a typical single Paper2Agent run would.
Try it — Live MRSimulator
The deployed Gradio app runs on Hugging Face Spaces. You can use the interface below to simulate NMR spectra directly — choose a simulation type, enter your parameters, and hit Submit.
Example: BaHf(PO4)₂ ³¹P NMR — Effect of MAS Spinning Speed
As a concrete demonstration, here are the NMR parameters for BaHf(PO4)₂ from the phosphate study (Martel et al., Solid State NMR 2020, Table 1):
| Parameter | Value |
|---|---|
| Isotope | ³¹P |
| δ_iso | −11.1 ppm |
| Δ_CSA | −53.1 ppm |
| η_CSA | 0.21 |
| Magnetic field | 9.4 T |
Using these parameters, we simulated the ³¹P spectrum at four conditions — static, 2 kHz, 3 kHz, and 5 kHz MAS — to show how magic-angle spinning progressively collapses the broad chemical-shift-anisotropy powder pattern into a sharp isotropic peak flanked by spinning sidebands:
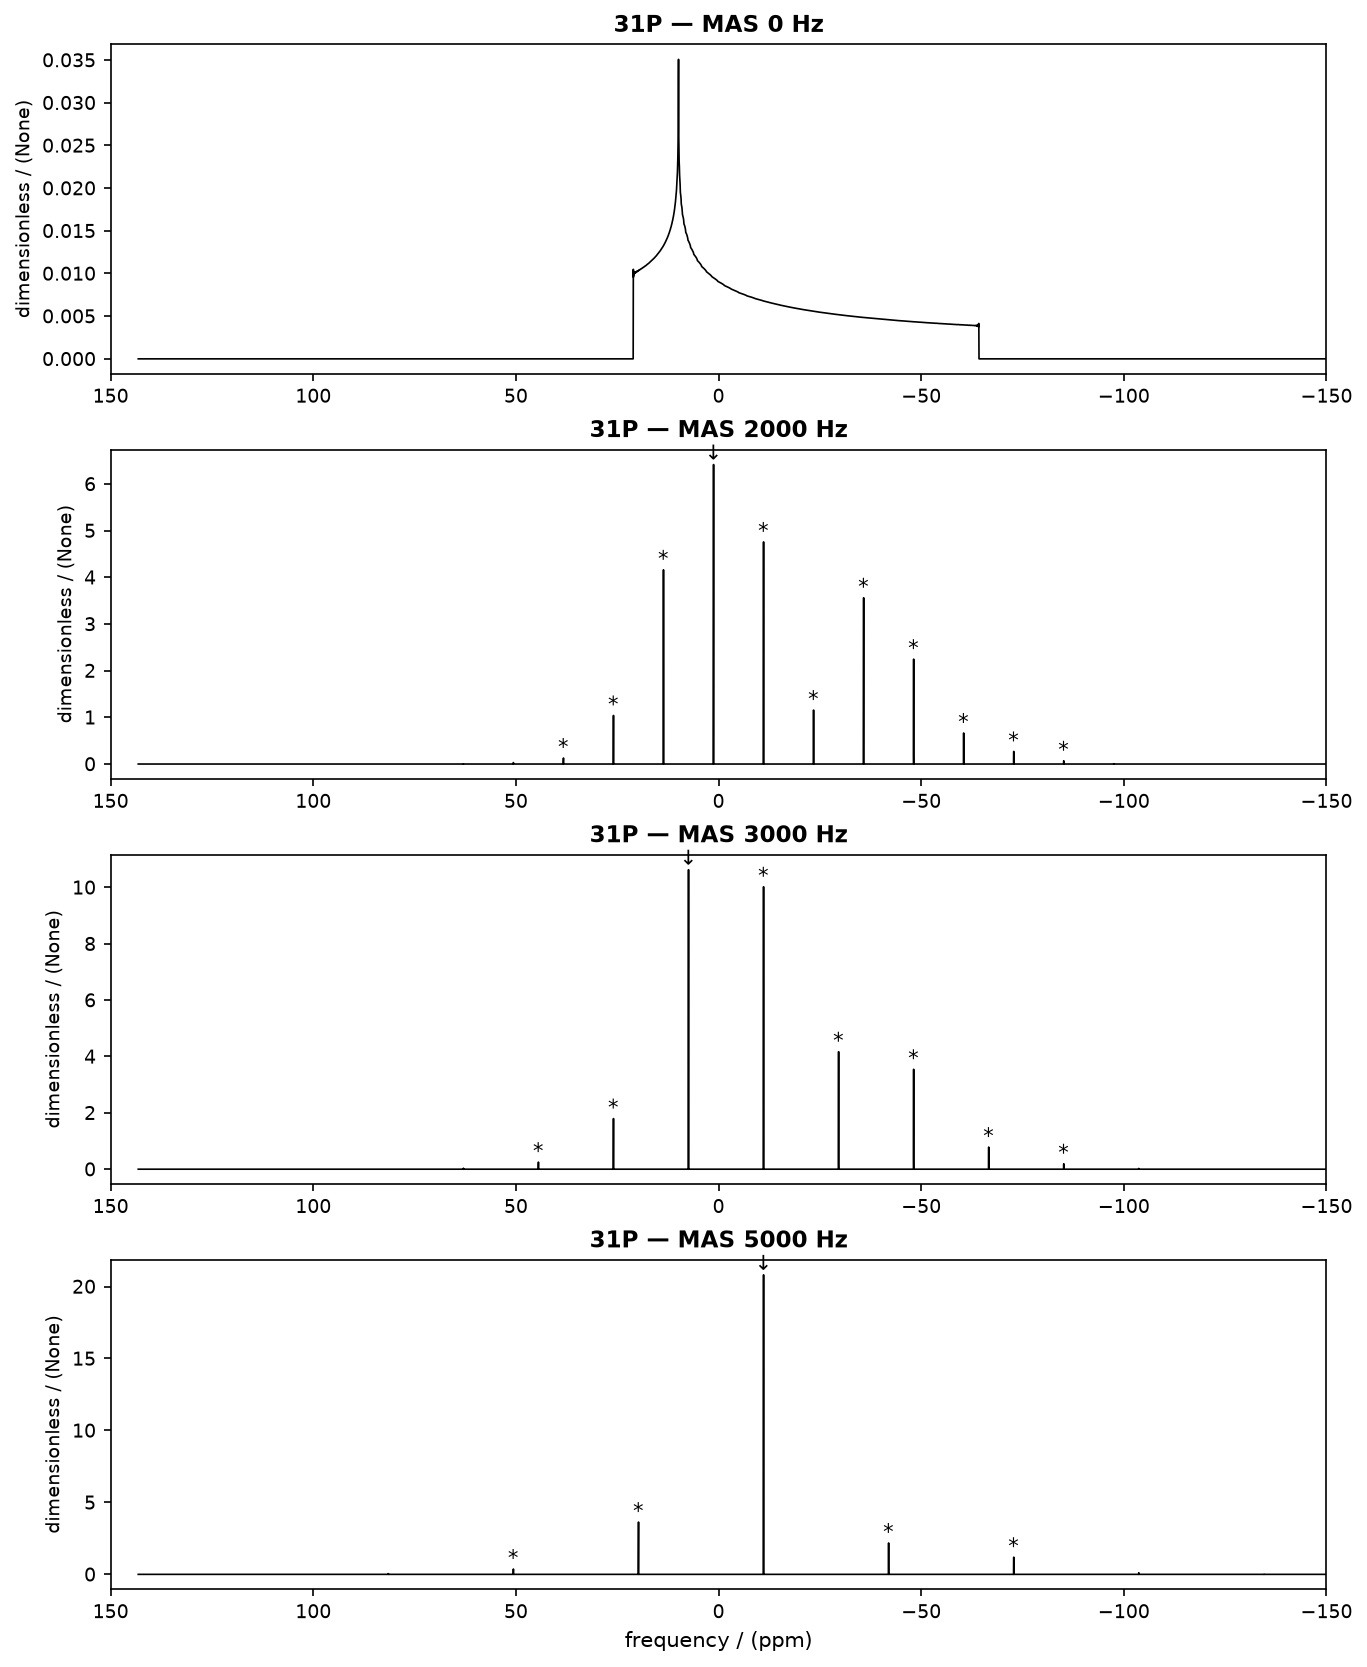
The static spectrum (top) shows the classic CSA powder pattern spanning ~80 ppm. Under MAS at 2 kHz, the broad pattern breaks into a manifold of spinning sidebands separated by 12.3 ppm (= 2000 Hz / 162 MHz). At 3 kHz the sideband spacing increases and the isotropic peak at −11.1 ppm grows dominant. By 5 kHz MAS only a few sidebands remain — matching the paper's own Fig. 2.
Example: RbNO₃ ⁸⁷Rb 3QMAS — Resolving Three Quadrupolar Sites
RbNO₃ has three crystallographically distinct Rb sites that overlap heavily in a normal 1D MAS spectrum because ⁸⁷Rb (spin-3/2) carries a large second-order quadrupolar interaction. A 3Q-MAS experiment correlates the triple-quantum and single-quantum coherences to separate the isotropic shift from the anisotropic quadrupolar broadening onto two axes, resolving the three sites that a 1D spectrum cannot. The parameters below are the published ⁸⁷Rb NMR values for RbNO₃ (Massiot, Touzo, Trumeau, Coutures, Virlet, Florian & Grandinetti, Solid State Nucl. Magn. Reson., 1996, Table 1):
| Site | δ_iso (ppm) | C_Q (MHz) | η_Q |
|---|---|---|---|
| 1 | −27.4 | 1.68 | 0.2 |
| 2 | −28.5 | 1.94 | 1.0 |
| 3 | −31.3 | 1.72 | 0.5 |
These parameters were sent directly to the deployed MCP server's multi-site MQMAS tool (9.4 T) to simulate the 2D correlation spectrum:
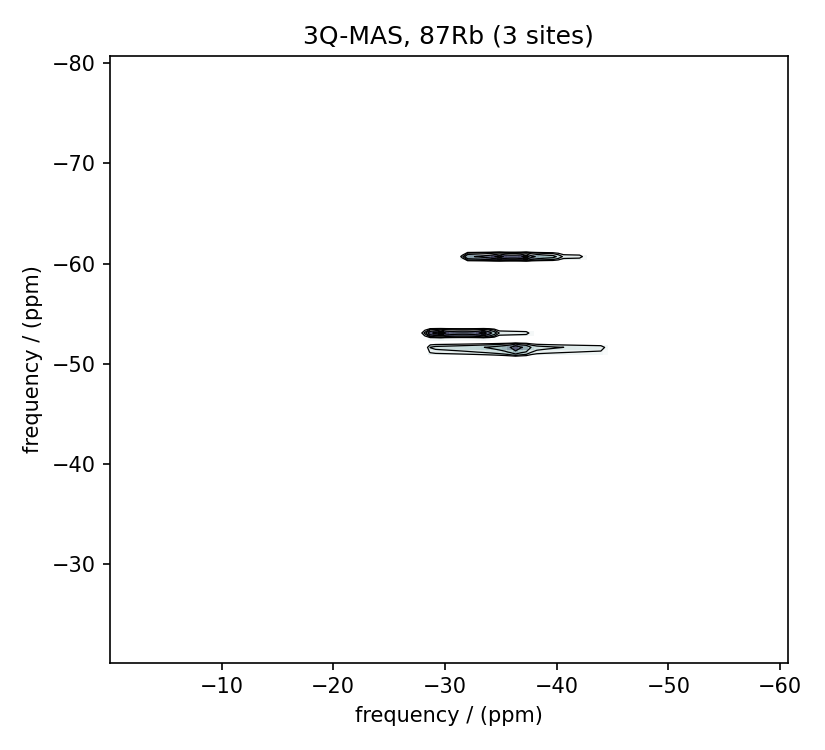
Even though sites 1 and 2 sit only ~1 ppm apart in isotropic chemical shift, their very different quadrupolar asymmetry (η_Q = 0.2 vs 1.0) gives them distinct second-order quadrupolar lineshapes, so all three sites separate cleanly along the isotropic (F1) axis — exactly the resolution problem 3QMAS is designed to solve.